'%3e%3cpath%20fill='%23C0E1E2'%20d='M7%200H4v20h3V0Z'%20/%3e%3cpath%20fill='%23C0E1E2'%20d='M16%2010h-3v10h3V10Z'%20/%3e%3cpath%20fill='%23C0E1E2'%20d='M0%2013v3h20v-3H0Z'%20/%3e%3cpath%20fill='%23C0E1E2'%20d='M0%204v3h10V4H0Z'%20/%3e%3cpath%20fill='%2360B2B6'%20d='M19.996%204v3H13V0h3v4h3.996Z'%20/%3e%3c/g%3e%3cdefs%3e%3cclipPath%20id='clip0_1029_1800'%3e%3cpath%20fill='%23fff'%20d='M0%200h20v20H0z'%20/%3e%3c/clipPath%3e%3c/defs%3e%3c/svg%3e) Data Editor
Data Editor  Subscribe
Mastering High-Performance Reports
Creating high-performance reports is an essential skill for any Business Central developer. I’m sure many of you have run into slow reports, but what if I told you they’re slow mainly because of poor design? Today, I outline a set of techniques and tips that will help developers build truly high-performance reports.
Agenda
- Introduction
- Reduce the size of the dataset
- Move image and static data to one-time-run data item
- Avoid any heavy logic on repeated triggers
- Use Query as Data Source
- Layout rendering
- Group data
- Summary
- Source Code
Introduction
First of all, it’s worth noting that reports in Business Central will always run more slowly than a direct SQL query against the database, no matter what you do. There are many reasons for this: trigger execution, the AL-to-SQL translation layer, limited control over the generated queries, the report layout engine, and so on. Still, we can approach close to SQL-level performance by squeezing the maximum out of the platform.
For comparison, I will create two reports: one with poor design and another that applies every tip and improvement. We will then compare their performance and see the difference. A good example of a slow report would be one that shows G/L Entry information based on certain filters.
I will show you a ready-made report that was intentionally designed with poor performance in mind. I think experienced developers will immediately spot several areas that need improvement. The idea is that with each iteration the report will become increasingly performant, and we will measure its speed on Cloud Business Central. I want to point out that since the Cloud BC dynamically allocates resources across nodes, your results may vary, but the overall performance ratios should remain roughly the same.
report 81810 "HPR Slow GL Report"
{
    ApplicationArea = All;
    Caption = 'Slow GL Report';
    UsageCategory = ReportsAndAnalysis;
    DefaultLayout = RDLC;
    RDLCLayout = './SlowReport/Layouts/SlowGLReport.rdlc';
    dataset
    {
        dataitem(GLAccount; "G/L Account")
        {
            RequestFilterFields = "No.";
            DataItemTableView = sorting("No.");
            column(No_GLAccount; "No.")
            {
                IncludeCaption = true;
            }
            column(Picture_CompanyInformation; CompanyInformation.Picture)
            {
            }
            column(ReportTitleLbl; ReportTitleLbl)
            {
            }
            dataitem(GLEntry; "G/L Entry")
            {
                DataItemLink = "G/L Account No." = field("No.");
                DataItemTableView = sorting("Entry No.");
                column(EntryNo_GLEntry; "Entry No.")
                {
                    IncludeCaption = true;
                }
                column(DebitAmount_GLEntry; "Debit Amount")
                {
                    IncludeCaption = true;
                }
                column(CreditAmount_GLEntry; "Credit Amount")
                {
                    IncludeCaption = true;
                }
                column(DocumentType_GLEntry; "Document Type")
                {
                    IncludeCaption = true;
                }
                column(DocumentNo_GLEntry; "Document No.")
                {
                    IncludeCaption = true;
                }
                column(PostingDate_GLEntry; "Posting Date")
                {
                    IncludeCaption = true;
                }
            }
            trigger OnAfterGetRecord()
            begin
                CompanyInformation.Get();
                CompanyInformation.CalcFields(Picture);
            end;
        }
    }

    trigger OnPreReport()
    begin
        StartDT := CurrentDateTime();
    end;

    trigger OnPostReport()
    begin
        Message('Result: %1', CurrentDateTime() - StartDT);
    end;

    var
        CompanyInformation: Record "Company Information";
        StartDT: DateTime;
        ReportTitleLbl: Label 'GL Report';
}
Reduce the size of the dataset
Let’s begin with the most obvious and most important point: reducing the dataset size. Dataset size has a huge impact on performance, and we will use several tips to make it smaller.
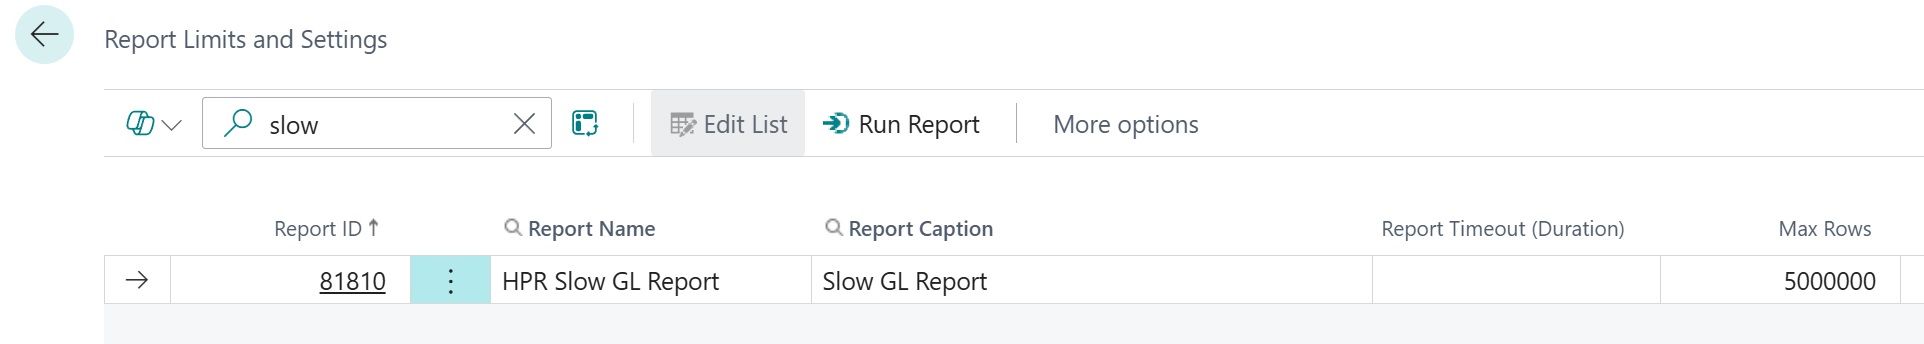
For testing, we will use the G/L Entry table with one million records. That means we need to raise the standard Max Rows limit from 500,000 to 5,000,000. You can do this each time you run the report in the Request Page → Advanced section, or set a default value on the Report Limits and Settings page.
When you run this report against a million records, you will get an error because the dataset size exceeds the file-size limits allowed in Business Central.
Rendering output for the report failed and the following error occurred: Stream was too long.
Move image and static data to one-time-run data item
There are several things that can be improved in the report, but I would start with the most important one. As I previously mentioned, as soon as you attempt to run this report for more than 10,000 records, you'll encounter an error. Therefore, it's crucial to first make this report functional in principle.
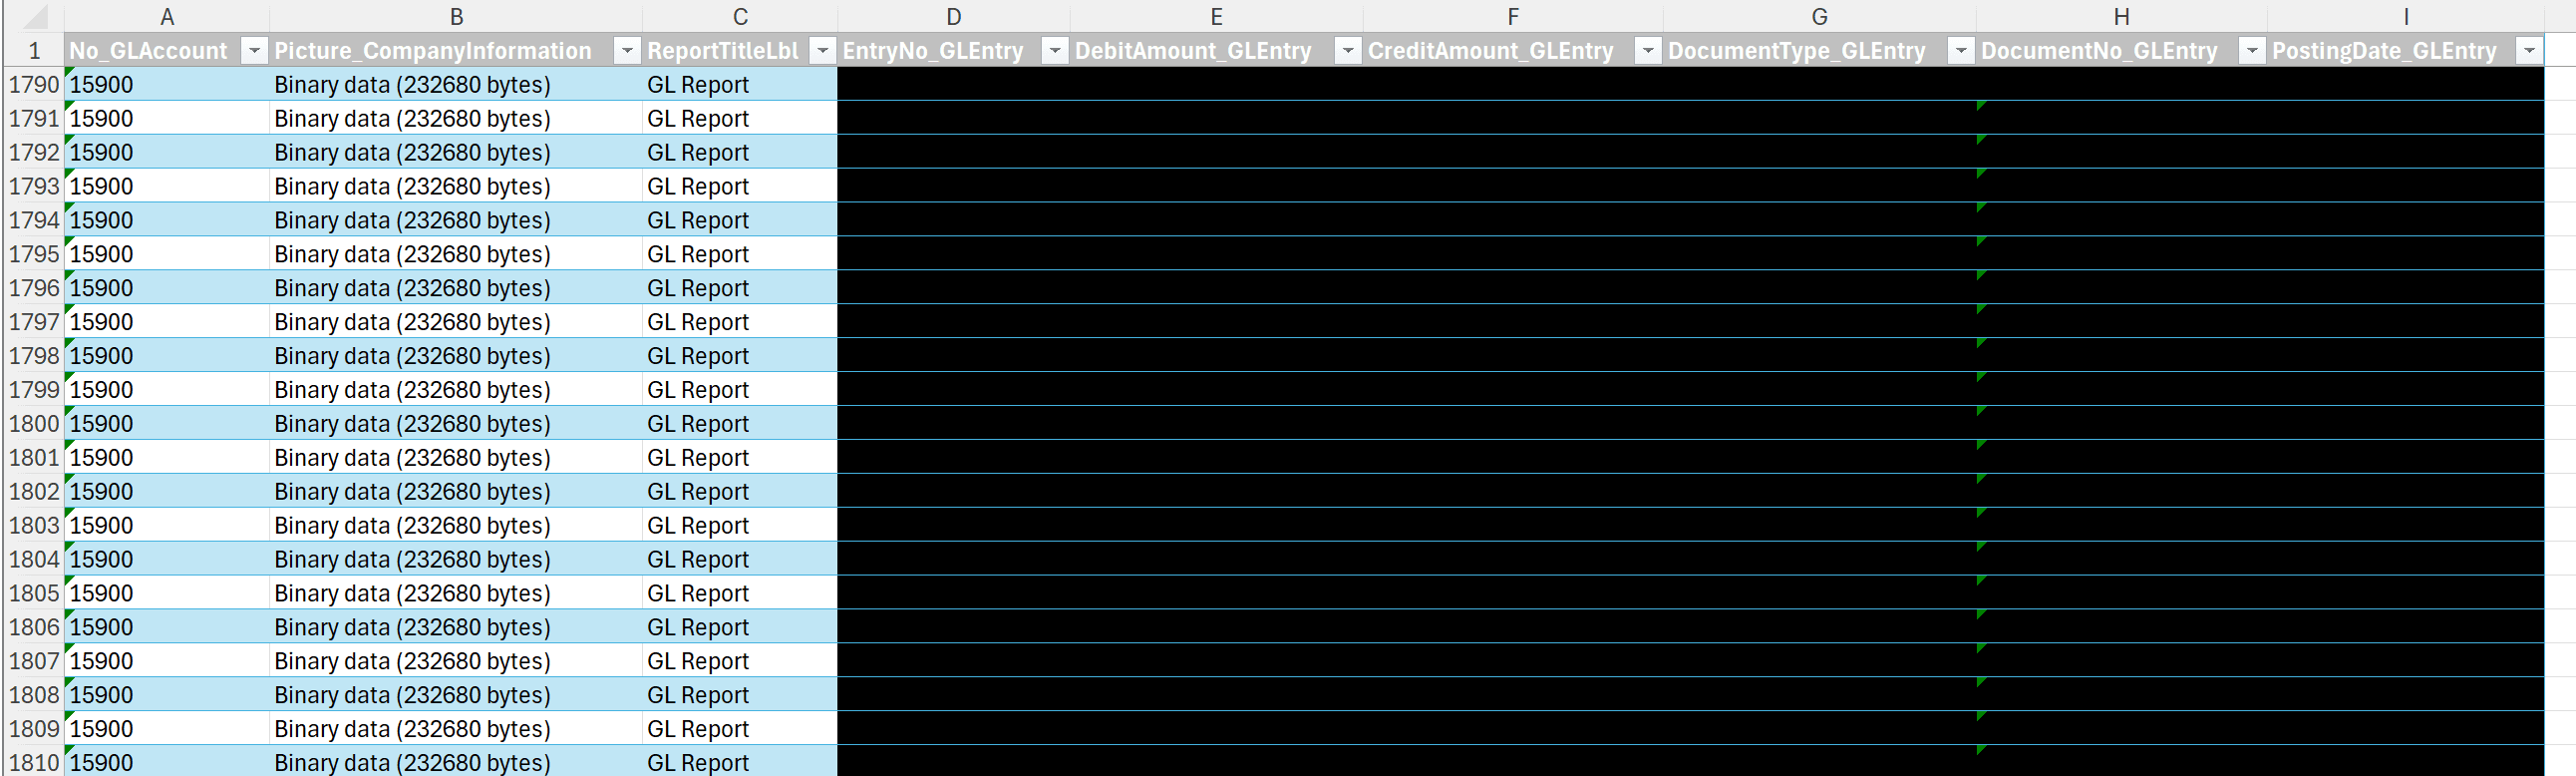
As you've probably guessed, the problem is that the dataset is excessively large, primarily due to the CompanyInformation.Picture field. The issue arises because when passing the image on the first data item (G/L Account), this binary data gets duplicated in the dataset for every entry in the nested data item (G/L Entry). To verify this, you can export the report as "Excel data only", and you will clearly see how the dataset is structured.
To avoid this data duplication, I suggest creating a separate DataItem at level 0, perhaps named DataStorage based on Integer table. The idea is to have this DataItem execute only once, which allows us to pass the image through this DataItem and avoid overloading the dataset size. To achieve it you can use filter on DataItem where(Number = const(1)) or property MaxIteration = 1;.
dataitem(DataStorage; Integer)
{
    DataItemTableView = sorting(Number) where(Number = const(1));
    MaxIteration = 1;
    column(Number_DataStorage; Number)
    {
    }
    column(Picture_CompanyInformation; CompanyInformation.Picture)
    {
    }
    column(ReportTitleLbl; ReportTitleLbl)
    {
    }
}
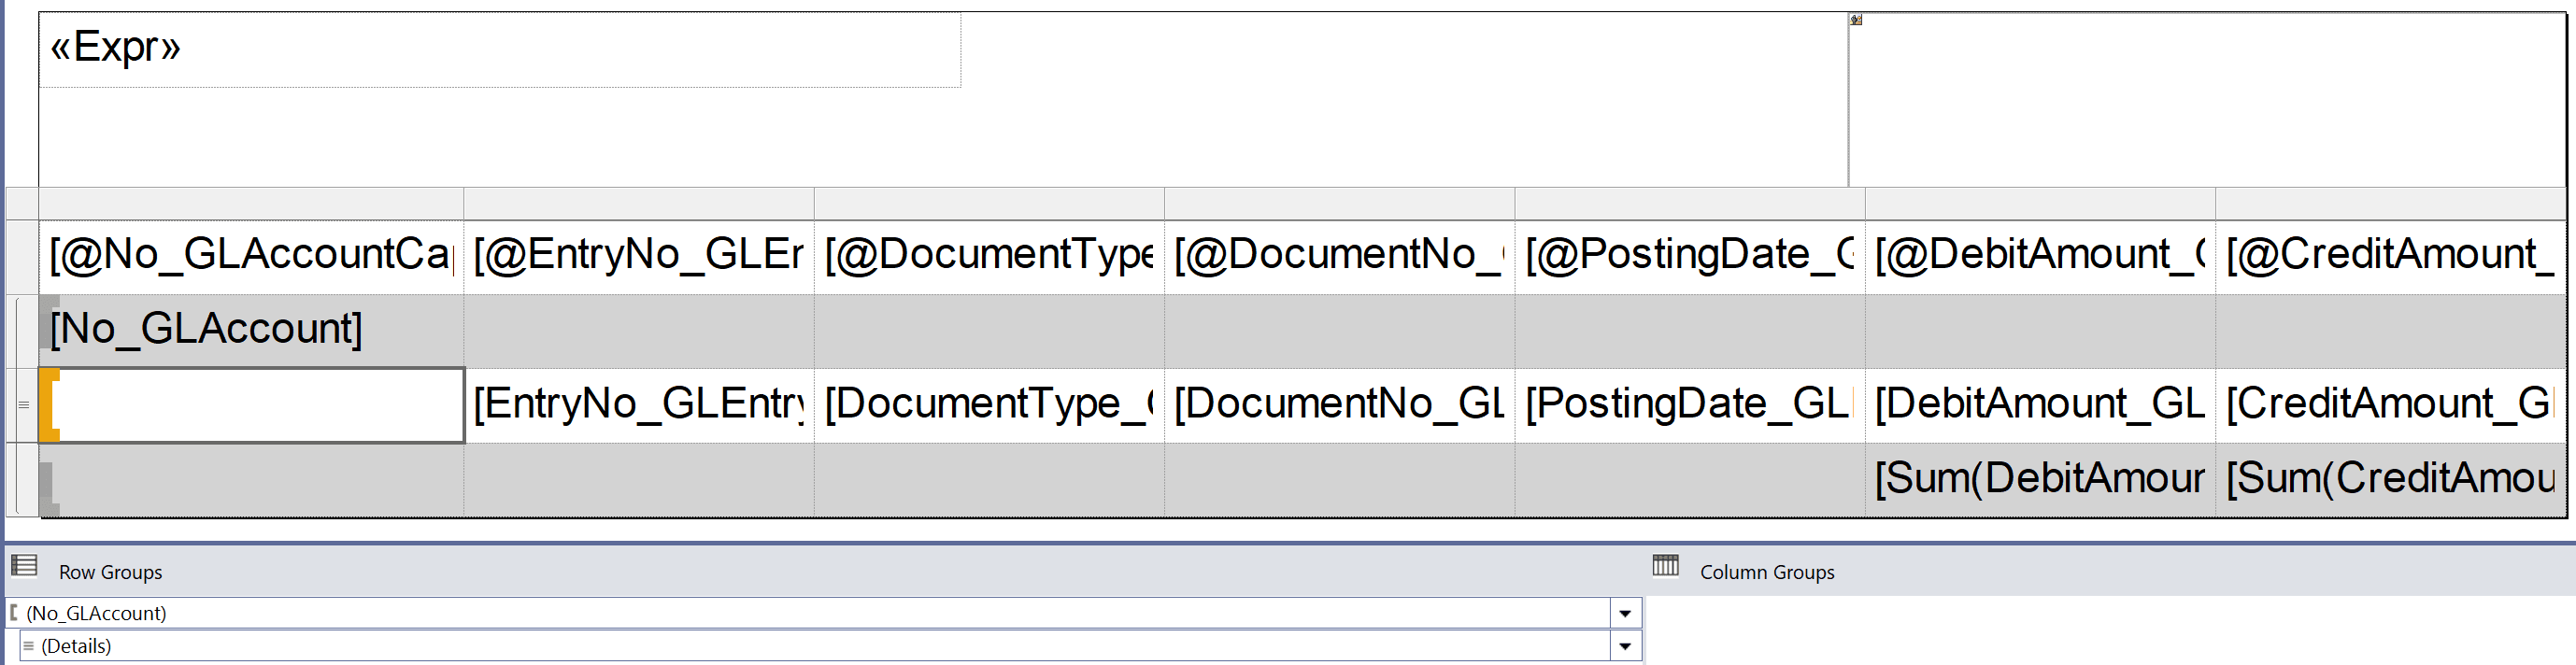
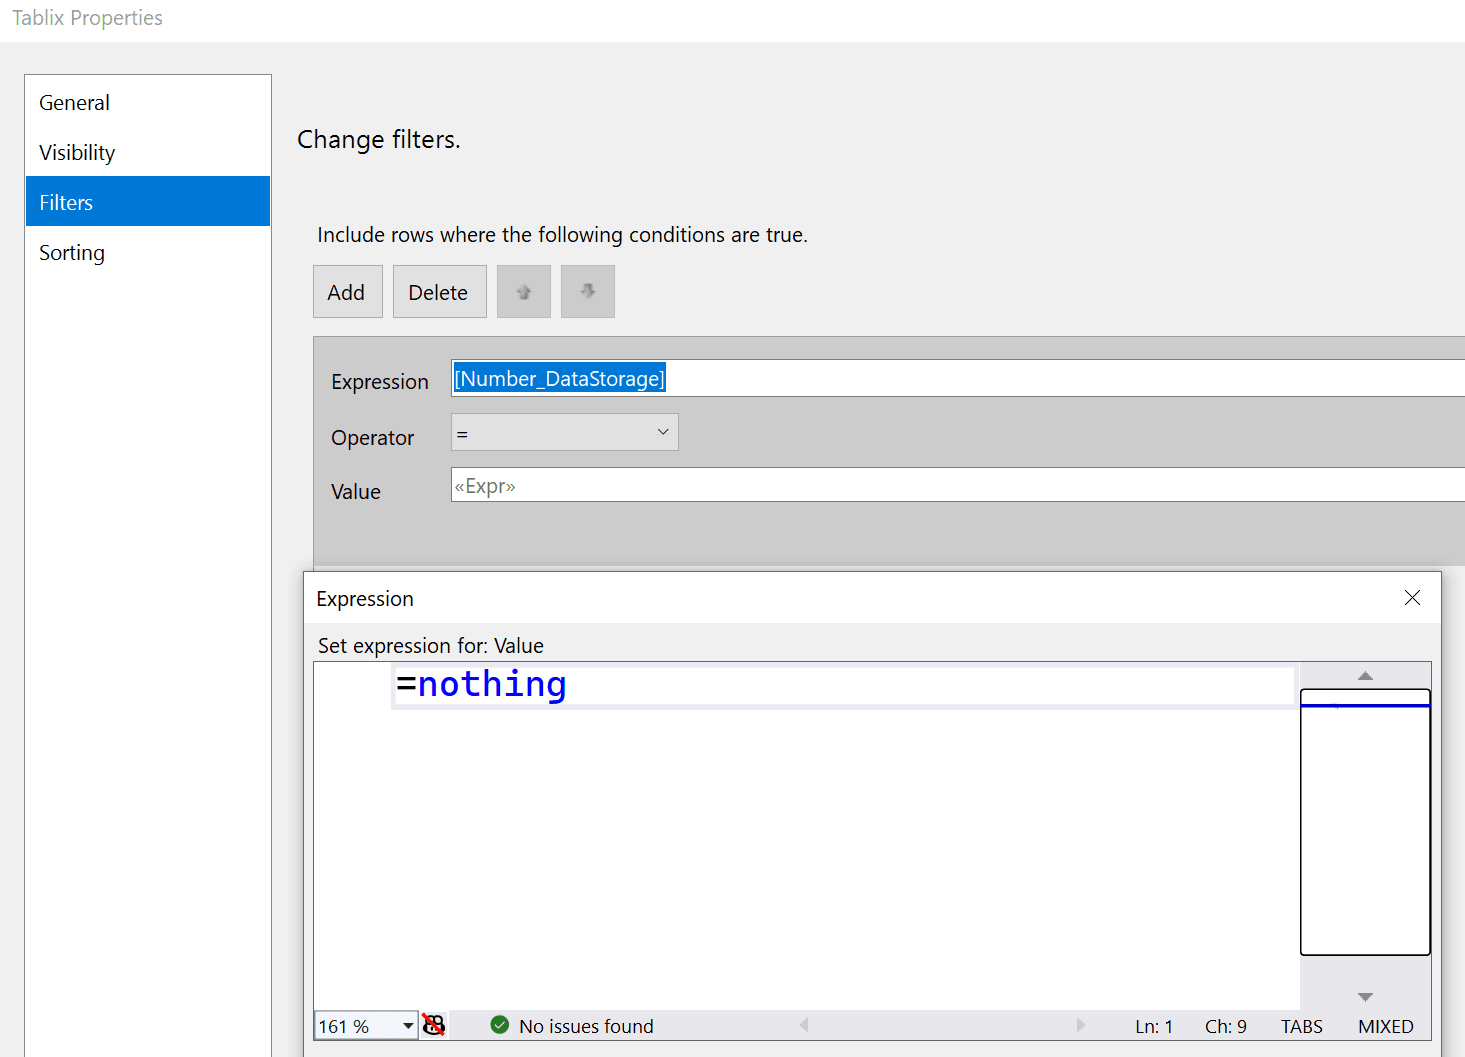
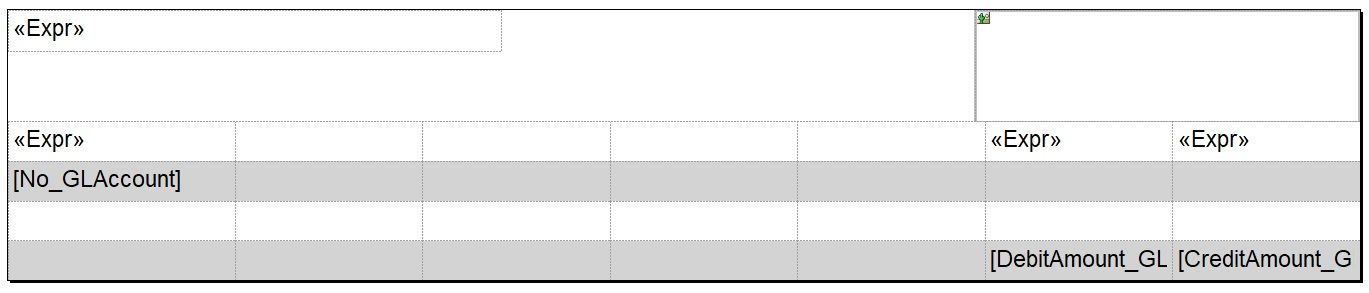
In general, it's a good idea to pass any static data through this separate DataItem. Also, it's worth mentioning that this level-0 DataItem should be filtered in the table, as shown in the screenshot below, to avoid unwanted artifacts. On header of layout we will do Last() instead of First() to get data of report title and image.
It’s also worth noting that older versions of Navision and Business Central OnPrem could load much larger datasets without raising an error. I’ve encountered many slow, poorly performing reports for exactly this reason: large binary data being passed in the wrong place.
I did take performance measurements before adding the DataStorage data item, but I could only test with a small record set, so I filtered for 5,000 records. I then ran the report again after the fix with both 5,000 and 1,000,000 records. The results are shown below.
Before DataStorage fix
| Record Count | Result / Runtime (sec) |
|---|---|
| 5 000 | 10 |
| 1 000 000 | Failed to run |
After DataStorage fix
| Record Count | Result / Runtime (sec) |
|---|---|
| 5 000 | 7 |
| 1 000 000 | 435 |
Avoid any heavy logic on repeated triggers
Avoid performing heavy calculations in triggers that fire repeatedly; this applies not only to OnAfterGetRecord but to any trigger on nested DataItems. For example, OnPreDataItem on G/L Entry will run once for every G/L Account.
In our case, we can simply move the code from OnAfterGetRecord to OnPreReport.
trigger OnPreReport()
begin
    CompanyInformation.Get();
    CompanyInformation.CalcFields(Picture);

    StartDT := CurrentDateTime();
end;
Use Query as Data Source
Use a Query as the data source for your reports, especially if you have multiple related Data Items, any grouping, or calculations. Queries are generally faster than using Data Items with the DataItemLink property, as they are more optimized and efficient. Additionally, you gain more flexible control over the SQL statement that is generated and sent to the database. For instance, you can specify the join type between different tables in the Query by using the SqlJoinType property.
For illustration, I created the simplest possible query, of course, the exact implementation will depend on your specific requirements.
query 81810 "HPR G/L Entry"
{
    Caption = 'HPR G/L Entry';
    QueryType = Normal;

    elements
    {
        dataitem(GLAccount; "G/L Account")
        {
            column(GLAccountNo; "No.")
            {
            }
            dataitem(GLEntry; "G/L Entry")
            {
                DataItemLink = "G/L Account No." = GLAccount."No.";
                SqlJoinType = InnerJoin;
                column(EntryNo; "Entry No.")
                {
                }
            }
        }
    }
}
Unfortunately, native embedding of a Query into a report still hasn’t been implemented, so one common workaround is to add an Integer table DataItem and use a global Query variable inside the report. Strictly speaking, the G/L Account table isn’t really needed as a DataItem anymore, but I kept it to make UI filtering more convenient.
It's also worth noting that it's best to reduce Query.Open(), as it's the slowest function in Query. But again, I will leave it as it is for this example.
dataitem(GLAccount; "G/L Account")
{
    RequestFilterFields = "No.";
    DataItemTableView = sorting("No.");
    dataitem(GLEntryInteger; Integer)
    {
        DataItemTableView = sorting(Number);

        trigger OnAfterGetRecord()
        begin
            if not GLEntryQuery.Read() then
                CurrReport.Break();
        end;
    }
    trigger OnAfterGetRecord()
    begin
        GLEntryQuery.SetRange(GLAccountNo, GLAccount."No.");
        GLEntryQuery.Open();
    end;
}
Layout rendering
After all these optimizations the report will be faster, yet still quite slow. Why? Because visual rendering takes up roughly 50% of the total execution time for slow version of report. When we optimize everything else, we’re really only accelerating the remaining 50%, so the overall report can’t get more than about 50% faster. In practice, the performance gain for the report that includes RDLC layout will be even smaller than the theoretical estimate. I would like to point out that as the number of DataItems grows, the impact of the optimizations we have made increases dramatically.
Also, that rendering occurs in parallel with dataset loading. So if layout rendering takes four minutes and loading the dataset takes three, the report’s total run time is unlikely to be seven minutes, but it won’t be just four either, because the dataset and rendering progress at different rates.
Group data
Are you sure you need full detail when working with large data volumes? Maybe a simple summary would suffice. That isn’t always possible, of course, but let’s consider the scenario where we only want to calculate some totals without the detailed information. In this case, we will greatly unload the DataSet by removing a huge number of pages.
We can use Query column methods to calculate/group data. In our case let's do sum for two columns by GL Account.
query 81811 "HPR G/L Entry Grouped"
{
    Caption = 'HPR G/L Entry';
    QueryType = Normal;
    elements
    {
        dataitem(GLAccount; "G/L Account")
        {
            column(GLAccountNo; "No.")
            {
            }
            dataitem(GLEntry; "G/L Entry")
            {
                DataItemLink = "G/L Account No." = GLAccount."No.";
                SqlJoinType = InnerJoin;
                column(DebitAmount; "Debit Amount")
                {
                    Method = Sum;
                }
                column(CreditAmount; "Credit Amount")
                {
                    Method = Sum;
                }
            }
        }
    }
}
The layout would also be simplified in that case.
Therefore, let’s compare the performance results of the reports before and after the optimizations, both with and without the layout.
Run for 1 million records
| Optimization Stage | No Layout (sec) | Layout (sec) | Result / Comment |
|---|---|---|---|
| Slow | — | — | Runtime error |
| Slow (Data Storage Fix) | 221 | 435 | The report became functional |
| Optimized | 18 | 393 | Huge increase without layout |
| Optimized Grouped | 2 | 2,5 | Huge increase in all scenarios |
As you can see, running the report without the layout shows a 12x performance improvement: 221 seconds → 18 seconds. But at the same time, the performance gain with the layout is less noticeable: 435 sec → 393 sec.
The problem is that an RDLC layout with more than one million rows is simply too much to handle, equivalent to several thousand PDF pages. So, what can we do about it?
It’s really quite simple: if you’re trying to print several thousand pages, you’re doing something wrong. In some cases, a report may indeed have to process several million records (though you should avoid that by applying filters). But printing a million records? That’s a very bad idea, you need to filter the data or group it in some sensible way.
Only the RDLC layout can print more than 120.000 rows, the Excel and Word layouts will throw an error.
Summary
A concise checklist for building high-performance reports
- Reduce the dataset size. The less data you load, the faster the report runs.
- Move images and other static data to a data item that executes only once. This is the most straightforward way to shrink the dataset.
- Avoid heavy logic in triggers that fire repeatedly. Self-explanatory, but critical.
- Use a Query as the data source. When applied correctly, a Query is much faster than a traditional DataItem.
- Group your data. Ask yourself whether you really need row-level detail for large volumes of data.
- Filter the data. Don’t let the report grow into a multi-thousand-page monster.
Benchmark (Cloud BC sandbox)
Run for 100.000 records
| Optimization Stage | No Layout (sec) | Layout (sec) | Result / Comment |
|---|---|---|---|
| Slow | — | — | Runtime error |
| Slow (Data Storage Fix) | 15 | 33 | The report became functional |
| Optimized | 1 | 29 | Huge increase without layout |
| Optimized Grouped | 0,1 | 0,3 | Huge increase in all scenarios |
Run for 1.000.000 records
| Optimization Stage | No Layout (sec) | Layout (sec) | Result / Comment |
|---|---|---|---|
| Slow | — | — | Runtime error |
| Slow (Data Storage Fix) | 221 | 435 | The report became functional |
| Optimized | 18 | 393 | Huge increase without layout |
| Optimized Grouped | 2 | 2,5 | Huge increase in all scenarios |